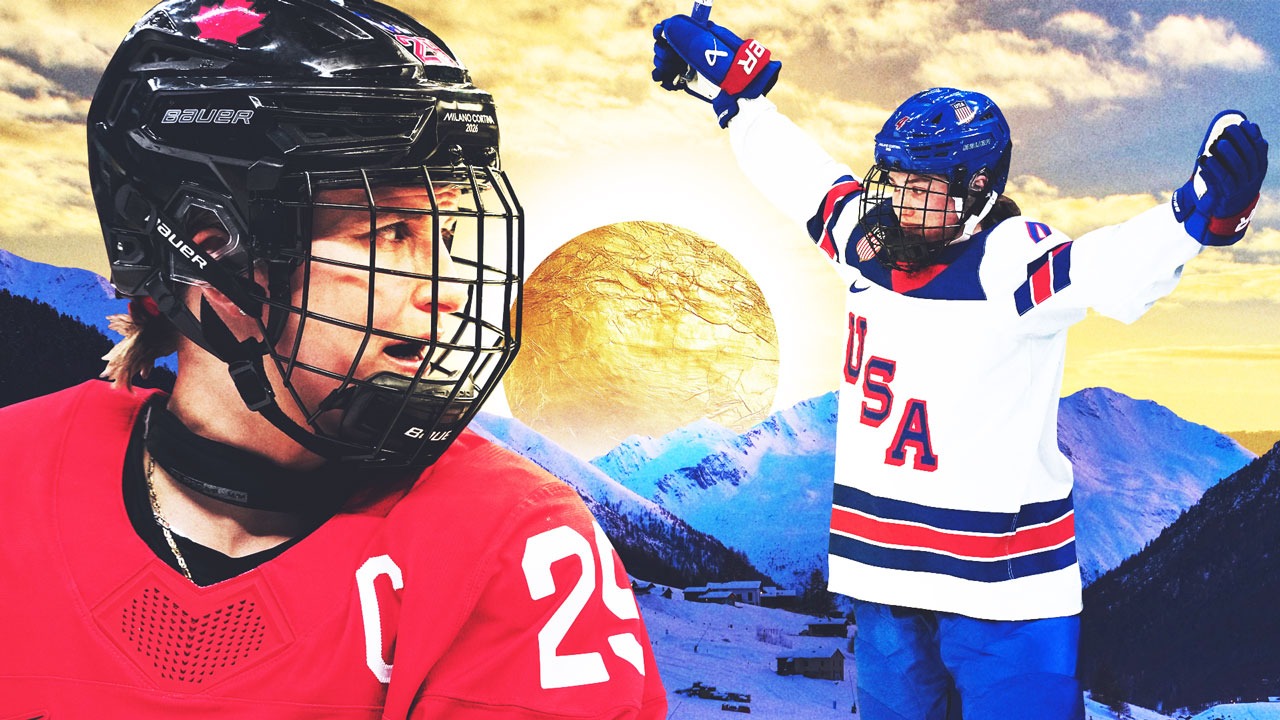
When the puck drops to start the women’s hockey final Thursday in Milan, Team Canada and Team USA will meet for the sixth time in the Olympic gold-medal game.
It’s the final showdown we all expected — these two nations have met with gold on the line in all but one Olympic tournament, with Canada now one win away from defending its place atop the throne.
To help set up another edition of hockey’s best rivalry, we delved into the numbers — from players’ measurables and ice time to how many days it’s been since Canada last beat Team USA and Marie-Philip Poulin’s jaw-dropping track record in Olympic finals.
Here’s a look at some key numbers in this storied matchup ahead of puck drop at 1:10 pm ET.
Canada vs. USA over the years
These teams have met in 23 of 24 world championship finals, and now six of seven Olympic gold-medal games. Here’s a look at some of the historic stats and records behind this unmatched rivalry.
1.75 —Average goals-per-game registered by Poulin in Olympic gold medal finals (across four appearances). In 26 career Olympic games overall, she’s scored at a 1.5 goals-per-game pace.
2 — Number of times the Olympic final has gone to overtime (or beyond). Canada won in OT at Sochi 2014, and Team USA won in a shootout in 2018.
2 — The largest goal differential in any Canada-USA Olympic final in history; four of the previous six meetings in this game have been decided by a single goal.
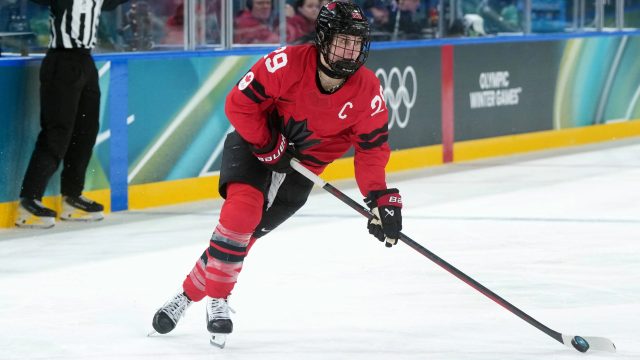
3 — Olympic gold medal game-winners scored by Poulin (in 2010, ’14 and ’22), the most by any hockey player ever. Three is also the number of Olympic gold medals No. 29 owns, the most of any player competing.
5 — Olympic appearances for both Poulin and American forward Hilary Knight, the most of anyone in this gold-medal game, and in history. In all, nine women have appeared in five Olympic tournaments, including Hayley Wickenheiser and Jayna Hefford. Both Wickenheiser and Hefford are four-time Olympic gold medallists.
7 — Number of consecutive games Canada has lost to Team USA heading into the 2026 Olympic gold medal final, dating back to last year’s Rivalry Series.
8 — Number of consecutive games Canada lost to Team USA heading into the 2002 Olympic gold medal final, which the Canadians won 3-2. (In other words, this isn’t new territory for the Canucks.)
20 — Goals scored by Poulin at the Olympics, which is the most all-time in women’s hockey, a record she set while potting a pair in Canada’s 2-1 semifinal win over Switzerland on Monday.
32 — Career points Knight has registered at the Olympics, the most by any American woman ever. Thursday will be the last Olympic game played by the one-time gold and three-time silver medallist on this stage. A day before the final, Knight proposed to her girlfriend, Olympic speedskater Brittany Bowe (and Bowe said yes!)
39 — Total career points Poulin has registered at the Olympics, second all-time behind Wickenheiser’s 50.
376 — Days since the Canadians last beat Team USA. Can they break the streak on Thursday?
Tape to tape: 2026 Olympic roster makeup
One of the biggest storylines of these Winter Olympics is the youth of Team USA compared to Canada’s experience and, well … older age. Let’s take a look at exactly how these teams stack up when it comes to age and other measurables that help tell the story of how these rosters were constructed.
5 — Members of Team USA from the State of Hockey, making Minnesota the most-represented state on the American team.
5-foot-two — The height of the shortest players in the gold medal game, American forwards Cayla Barnes and Kendall Coyne Schofield.
6-foot-one — The height of the tallest player in the gold medal game, American defender Laila Edwards. The 22-year-old Olympic rookie has been excellent in her debut, ranking third overall in tournament scoring with seven points in six games.
7 — American players still playing college hockey, compared to zero from Canada.
12 — Olympic rookies suiting up for Team USA, including all three goaltenders and the tournament’s leading scorer, defender Caroline Harvey. Canada has seven Olympic rookies, including 28-year-old defender Kati Tabin, the oldest rookie competing.
14 — Players on Canada’s roster from Ontario, the most-represented province in the final.
20 — Age of American forward Joy Dunne, the youngest competitor in the gold medal game.
25.8 — Average age of the 23-woman American roster.
29.2 — Average age of the 23-woman Canadian roster (that’s 3.4 years older than Team USA’s).
37 — Age of Canadian defender Jocelyne Larocque, the oldest competitor in the gold medal game.
126 lbs. — Weight of both Canadian forward Kristin O’Neill and USA’s Coyne Schofield, making them the lightest players on the ice.
190 lbs.— Edwards’s weight; she’s the heaviest player on the ice.
Stats that tell the story of the 2026 Games
History favours Team Canada when these nations go head-to-head, but looking at the stats from Milano Cortina 2026 shows us exactly why the Americans are favoured for gold heading into this final showdown.
.983 — The save percentage of Team USA starting goaltender Aerin Frankel, whose otherworldly stat line through four starts in Milano Cortina includes a 0.25 goals-against average and three shutouts — including one against Canada.
.901 — Ann-Renee Desbien’s save percentage over four appearances, which is ninth best at these Games. (Her 1.81 goals against per game ranks her third.) Canada’s starter entered the tournament undefeated at the Olympic level but suffered her first loss in preliminary play against the Americans. Desbiens, 31, is now 9-1 on this stage.
1 — Number of goals scored against Team USA through six games at these Olympics. That goal was scored by Czechia’s Barbora Jurickova on the first day of the women’s tournament, with the Americans shutting the door ever since.
4 — Goals scored by Team USA forward Hannah Bilka, making her the tournament’s current goal-scoring leader. Two of those goals came against Canada in the preliminary round.
5-0 — The final score of Team USA’s lop-sided victory over Canada in round-robin play last week, which marked the Americans’ largest margin of victory over Canada at the Olympics and the first time the Canadians have ever been shut out at this level.
7 — Number of Americans listed on the top-10 points leaderboard. Just one Canuck made the list (Daryl Watts, at No. 2).
8 — Watts’ point total at these Games, which has her sitting second tournament-wide. The first-time Olympian has been Canada’s top playmaker, with a team-best six helpers.
8 — Number of goals scored by Team USA defenders at the tournament, which accounts for more than a quarter of the club’s goals. For comparison, Canada has struggled to produce much offence from its own blue line, with Claire Thompson the lone defender to score for the Canucks.
9 — Team USA defender Carolina Harvey leads the Olympic tournament in points, registering nine in six games. She also leads the tournament in assists, with seven.
12 — The number of different goal-scorers for Team Canada at these Olympics. Six of them have tallied multiple goals.
15 — The number of different goal-scorers for Team USA, 11 of whom have registered multi-goal games at the Olympics.
18 — The number of Canadian skaters (out of 20) who’ve registered at least one point in Milano Cortina.
19 — The number of American skaters who’ve registered at least one point at the tournament.
21:24 — Canadian defender Renata Fast’s average ice time, making her the busiest skater on the squad.
22:31 — Harvey’s team-leading average ice time per game, adding to her case for Team USA’s MVP in this tournament.
31 — Total number of goals scored by Team USA at the Olympics. Canada sits second in total goals scored, with 21.
36.84 — Canada’s tournament-leading power-play percentage, which has given it a real edge offensively as they routinely make opponents pay for penalties. (Team USA has drawn more penalties than anyone, but has struggled to cash in with the advantage relative to its rivals north of the border with a fourth-best success rate of 20 per cent.)
70.94 — Alex Carpenter’s tournament-leading faceoff win percentage, which just barely edges out Poulin’s second-best 69.09.


