During the NHL season coaches prep for upcoming matchups differently, but invariably they receive a pre-game package from their analytics team with all the numbers they may want to consult. That usually features any notable outliers a particular matchup might bring, like a player or line who’s done particularly well/poorly in previous matchups, or a game state where a team has shown to be uncommonly vulnerable. Niche parts of the game. The aim is to ensure the staff doesn’t miss anything unique about a given opponent.
We don’t have access to each team’s internal data, but those outliers are generally laid out in plain sight if you just look in the right places. We can still pick through some general numbers and find a few that point to some series advantages. The difference is we may see them as “that team gives up too many goals,” where the team sees “we give up too many goals because we can’t defend zone entries on our right side.” But at the end of the day, the point for us is the same — too many against ain’t good.
So let’s pick through some stats to see which teams have notable advantages/disadvantages heading into their upcoming play-in series.
NHL Newsletter
EASTERN CONFERENCE
Toronto Maple Leafs vs. Columbus Blue Jackets
A few stats to discuss…
1. Columbus can’t score, like at all. Yes they had injuries throughout the year, but here’s a look at the bottom of the standings in goals-for per game this season, which includes only two teams that made the 24-team “playoff.”
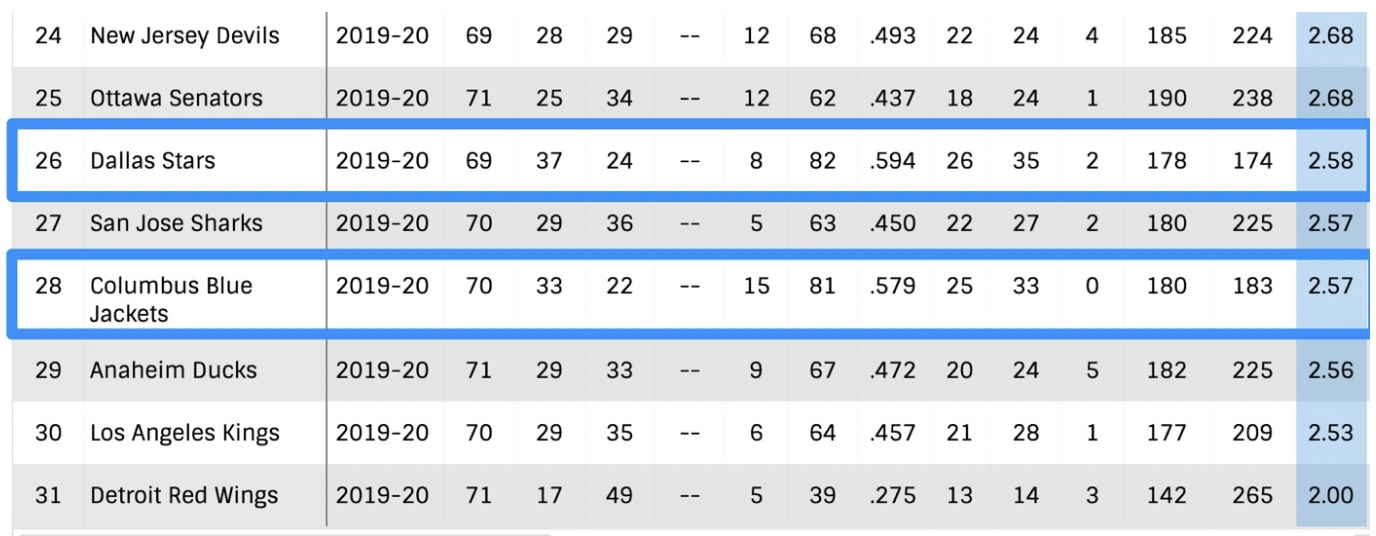
That’s not great company, injuries or not.
(Interestingly, if you sort the league by goals-against per game, twice as many play-in teams show up at the bottom: the Panthers, Leafs, Rangers and Wild. You just have to be able to score. I’m also of the belief that you can “bear down” your way to better defence, but not to creating more goals. Not being able to score is a bigger concern than struggling to defend during the regular season.)
If Columbus were healthy all year, I’m sure they’d be higher than 28th, but against any fully healthy opponent with playoff stakes, goals won’t be easy to come by. The Leafs were 26th in the league in goals against this season, though from the time Sheldon Keefe took over, they were 17th.
2. Of the 16 play-in teams, only Montreal had a worse goal differential than Columbus’ minus-7. Again, Columbus was crushed by injuries this year…
But Pittsburgh had more man-games lost than Columbus and were plus-28 this season. The Leafs, who are right behind Columbus in man-games lost, had a plus-11 goal differential. So, take that as you’d like.
3. Still, there’s a ton in the positive column for Columbus. Their excellent defence left them with the fifth-best shot attempt differential at 5-on-5 (Leafs were 12th), and as I wrote previously, Columbus created more than any team in the NHL off the forecheck. They have the tools to push the play out of their own end and on to Toronto’s defence, exactly where the Leafs don’t want to be. Toronto’s D gave up more goals against off the cycle than any team in the NHL this season (per SportLogiq).
4. The Leafs had more O-zone possession time per game than any other team in the NHL — nearly seven minutes at 5-on-5 with the puck squarely in their possession. The territorial battle is going to be key.
New York Islanders vs. Florida Panthers
Who ya got?
— Justin Bourne (@jtbourne) July 21, 2020
A few stats to discuss…
1. Florida gave up piles of goals this season, finishing 28th in the NHL in goals-against per game. Yes, a big part of that was due to clean-but-concerning numbers for Sergei Bobrovsky:
Cap hit: $10 million
Save percentage: .900
But the bigger point is that being 28th in goals against isn’t just a few saves away from being average. They give up a ton.
2. But they survive because they’re sixth in the league in goals-for per game.
So the Isles have the silver lining that while they don’t score a ton — they were 22nd in GF/G — they’re not exactly going up against the trapping New Jersey Devils of yore. The Isles will have other problems, though.
3. Florida does score, as we noted, and the Isles actually get filled in from a shot attempt perspective. They were 26th in shot attempt differential, with only Ottawa allowing more raw shot attempts against in 2019-20. The Isles block a pile of shots, so the actual shots against numbers aren’t so bad, but that’s a dangerous way to live against a team that can finish like Florida.
Carolina Hurricanes vs. New York Rangers
Who ya got?
— Justin Bourne (@jtbourne) July 21, 2020
A few stats to discuss…
1. The contrast between the Hurricanes being 11th in goals-for per game and the Rangers being 23rd in goals-against per game should be a concern for Rangers fans. They also traded away a pretty good defenceman in Brady Skjei at the deadline. The levees to keep back the Hurricanes … I’m not sure I trust ‘em.
2. The Rangers’ saving grace is they can certainly score as well, finishing fifth in goal-for per game. And the Hurricanes’ crease is a legitimate question mark. So … bet the over in these games?
3. I expect the Rangers to have to score a lot to win the series, because New York’s PK is 23rd and Carolina has a top-10 PP. Dougie Hamilton is back healty, too.
4. Only five teams in hockey stacked up a better goal differential than the Canes’ plus-29 this year (the Rangers were plus-12), and further, Carolina were third in shot attempt differential. Those are bright, shining positives. Given the Rangers were 21st in shot attempt differential, I expect there to be a ton of play in New York’s end. The Rangers definitely have the goalies in this series, but they’re gonna need an A-plus-plus performance from whoever gets the nod there.
Pittsburgh Penguins vs. Montreal Canadiens
Who ya got?
— Justin Bourne (@jtbourne) July 21, 2020
Voters think there’s more than a 92 per cent chance the Habs will have a 12.5 per cent chance at Alexis Lafreniere. So yes Habs fans, they’re telling you there’s a chance.
Some stats to discuss…
1. If this series looks pretty lopsided, it’s because it almost certainly is. Stay tuned for the but maybe at the end here, but the reality is Montreal was 19th in the league in goals-against per game, 19th in goals-for per game, 19th in penalty kill, and 22nd in power play percentage. Pittsburgh was better (by a good deal) in every category.
2. That all led to a minus-9 goal differential for the Habs, the worst of any team in the play-in round. Pittsburgh, as mentioned earlier, was plus-28.
Here’s your but maybe…
3. One thing that’s been strange about the Habs all year? They’re not just “OK” in the shot attempt differential category, they’re downright dominant. At 5-on-5 the Habs were second in the entire NHL when it came to controlling the percentage of shots that were taken in their games. Montreal took 53.44 per cent of them.
It may not look like much, but it’s a pretty noteworthy number. That means you’ve got a team that controls the shots in-game as well as anyone, and has a goalie with a ceiling as high as any in the league. So yes, they’re massive underdogs, but let’s not pretend there isn’t a formula where the Habs could surprise the Pens.
WESTERN CONFERENCE
Calgary Flames vs. Winnipeg Jets
Who ya got?
— Justin Bourne (@jtbourne) July 21, 2020
Some stats to discuss…
1. At 5-on-5 the Flames were 20th in the NHL at producing goals, while the Jets were inside the top-10 at preventing them. Obviously if that holds true, it’s a problem for a Flames team whose output doesn’t seem to line up with its ample talent.
2. A huge part of — all of, maybe? — that Jets defensive success can be credited to their goaltending, which had the fifth-best all-strengths save percentage in hockey (a bit over .913 as a tandem). As we know, Winnipeg’s starter Connor Hellebuyck was even better than that.
The website Clear Sight Analytics has some great goalie stats that go beyond the standard GAA and save percentage. One is “goaltender save contribution” which is the difference between how many goals a netminder should give up based on the quality of chances they face, versus the amount of actual goals they allow (a more thorough explanation exists on the site).
Hellebuyck was the best in the league there, just edging out Vancouver’s Jacob Markstrom:
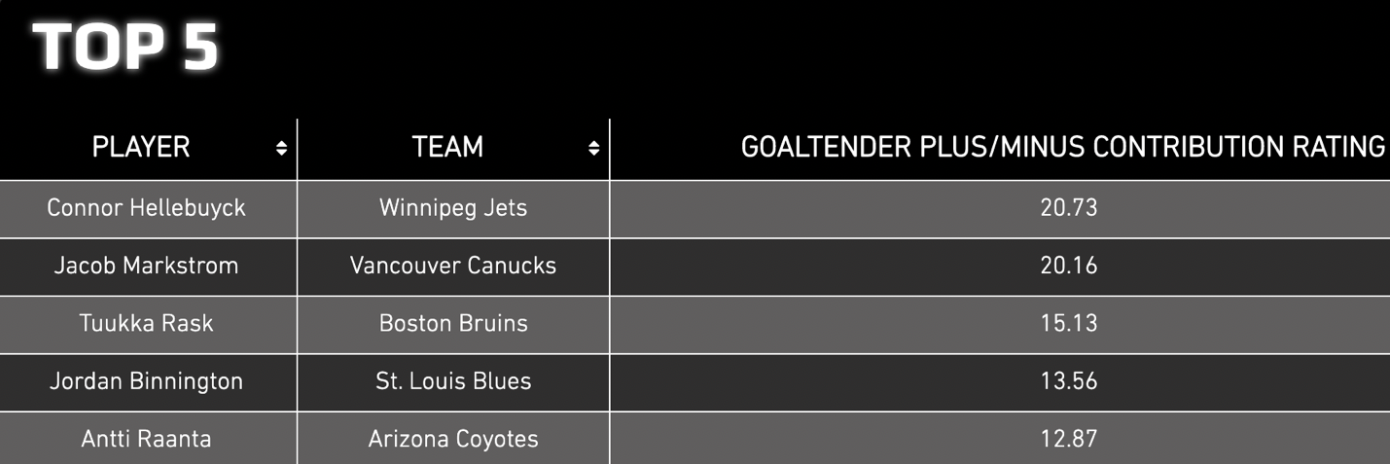
As I understand that, Hellebuyck prevented more than 20 goals this season that a league average keeper would’ve given up.
3. With that kind of performance in net, though, you’d expect more than what the Jets actually did over the 2019-20 schedule. Had the season ended cold when it did in March and picked back up with a regular playoffs, they’d have been on the outside looking in. That’s partially because they were 28th in shot attempt differential, tallying less than 48 per cent of the shots taken in the games they played this year. (The Flames were 20th, taking 49.2 per cent of shots in their games.)
4. It’s not hard to find skepticism around “expected goals” as a stat, but it can be useful in finding the outlier teams that should likely be doing better or worse than their actual spot in the standings. The shot attempts stat I mentioned above — the Jets give up a lot — contributes to Winnipeg’s awful expected goal percentage, which the analytics site Evolving Hockey has at 43.1 per cent (at 5-on-5), dead last in the NHL. And don’t forget, the Red Wings exist.
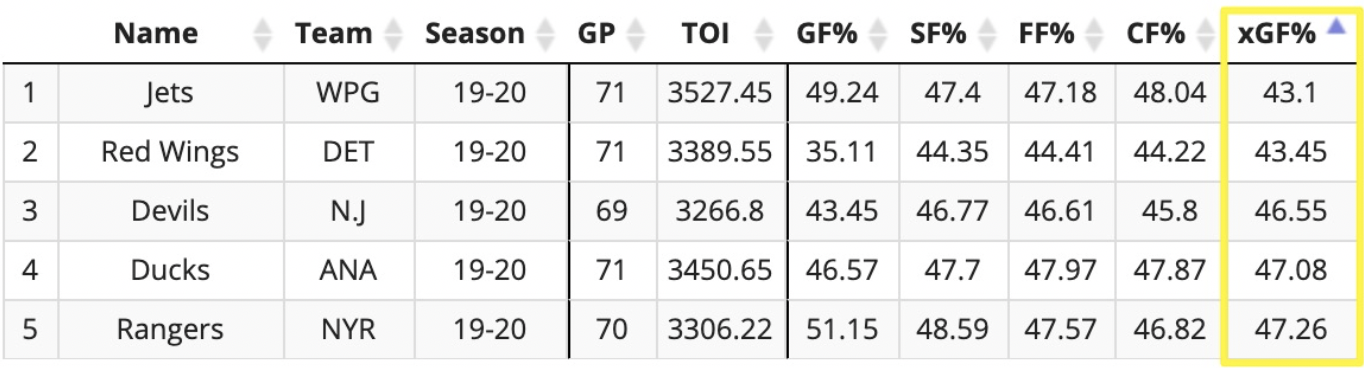
The Flames were just inside the top half of the league in expected goals.
Vancouver Canucks vs. Minnesota Wild
Who ya got?
— Justin Bourne (@jtbourne) July 21, 2020
Some stats to discuss…
1. I mentioned earlier that Carolina/NY Rangers might be a good series to look at the overs. Methinks we’ve got another one here.
Vancouver: 8th in GF/G
Minnesota: 24th in GA/G
So the Canucks should be able to score.
Minnesota: 12th in GF/G
Vancouver: 20th in GA/G
The Wild should be able to score, too.
Vancouver: 4th in PP (24.1 per cent)
Minnesota: 25th in PK (77.2 per cent)
Vancouver’s power play should be able to score. That’s pretty lopsided.
And sure…
Minnesota: 10th in PP (21.3 per cent)
Vancouver: 16th in PK (80.5 per cent)
Minnesota’s power play should be able to score, too.
2. The above stats are sorted to suit my narrative that I think there’s gonna be a lot of goals, but you could also look at it as: Vancouver scores more, gives up less, has a better power play, and a better penalty kill. Four green checks for the Canucks there.
3. Minnesota is no pushover, but they’ve been submarined by their goalies. You remember the Clear Sight chart where Markstrom showed as the league’s second-best goalie this season? Now here’s the bottom five:
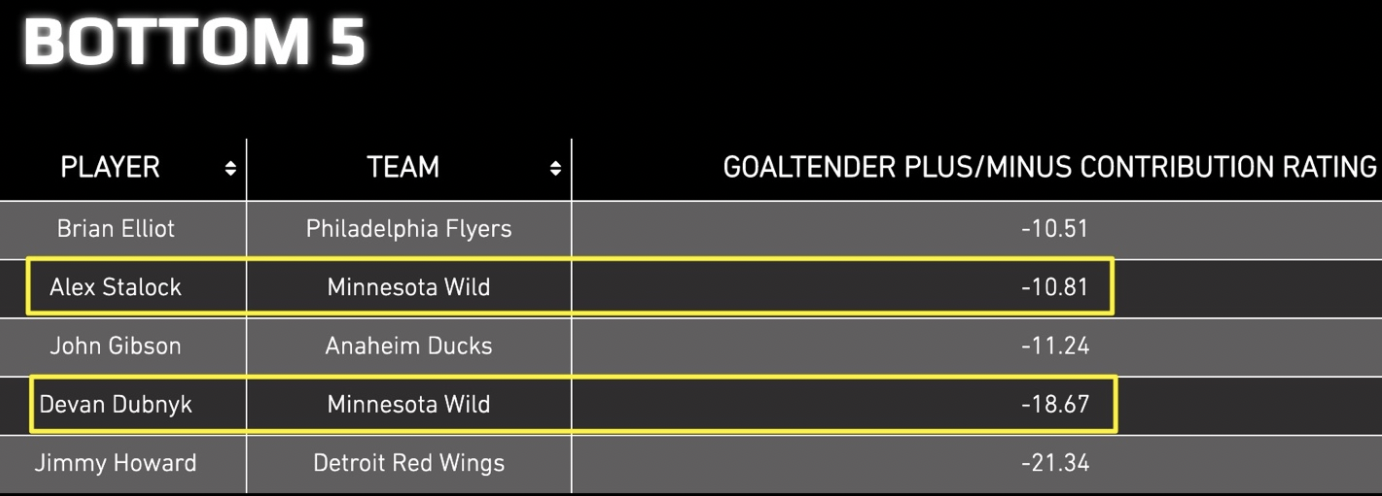
Elias Pettersson, Brock Boeser, J.T. Miller, Quinn Hughes, these guys have to be licking their chops.
Nashville Predators vs. Arizona Coyotes
Who ya got?
— Justin Bourne (@jtbourne) July 21, 2020
Some stats to discuss…
1. In some respects, this is the opposite of the potential offence-fest I alluded to above, starting with Nashville being 16th in scoring this year, going up against a Coyotes team that was third-best at preventing goals. Combine that with Arizona being just 23rd in goals-for this season and, well, it’s not impossible to see a low scoring matchup. I smell overtimes.
2. Nashville’s power play was 25th in the league this year (while the Coyotes’ PK was fifth-best), and Arizona’s power play was in the bottom half of the league, too, at 18th. (Will anybody score? Tune in to find out!)
The Predators’ PK was one of the worst in hockey, but still: doesn’t seem like a lot of 7-4 shinny-style scores coming our way here.
3. Where we do have a similarity to the Vancouver/Minnesota series: one team was statistically better pretty much everywhere — in this case it’s Arizona, save for their offensive output at 5-on-5, which wasn’t far behind Nashville’s. And with that, the team with the better stats also received far better goaltending.
Arizona had the third-best save percentage this year (all-strengths), while Nashville was 23rd. Darcy Kuemper was a Vezina front-runner before injury took him out. Pekka Rinne and Juuse Saros combined for a .906 this year.
In all, this series seems most misaligned with public perception. I like how Arizona matches up.
Edmonton Oilers vs. Chicago Blackhawks
Who ya got?
— Justin Bourne (@jtbourne) July 21, 2020
Some stats to discuss…
1. The below might be relevant in this series, don’t ya think?
Edmonton: 1st in PP (29.5 per cent)
Chicago: 9th in PK (82.1 per cent)
Chicago: 28th in PP (15.2 per cent)
Edmonton: 2nd in PK (84.4 per cent)
Still, I feel like teams that thrive via special teams could run into some roadblocks in the play-in round, given that everyone has had so much time to pick apart how they’ve had their success. It’s true that when you have more players you should be able to execute and continue to have success, but if Chicago can game plan to take away Edmonton’s best options, it could complicate things for the Oilers a bit. Still, the Oilers should be OK given that their success hinges so much on raw talent and not just structure. In terms of goals at 5-on-5 these teams have been basically pick ‘em:
Edmonton: 15th in GF/G
Chicago: 16th in GA/G
Chicago: 18th in GF/G
Edmonton: 15th in GA/G
2. According to Evolving Hockey, only three teams in the NHL were worse than the Blackhawks when it came to controlling shot attempts. The Oilers weren’t great either (21st, with 48.6 per cent) but that’s closer to company like the Canucks and Stars, while the Hawks are within a stick’s length of the Senators and Devils.
3. The thing is, Chicago has some offence. The numbers I mentioned in point two exist because at 5-on-5 the Blackhawks gave up over 1.5 shots against more than the next-worst team in the NHL in that category (per 60 minutes). If the whole game were 5-on-5 the Blackhawks would still give up close to 35 against per night. It’s a five-lane highway to their net.
4. So the Hawks don’t defend well, but they did get the seventh-best goaltending in the NHL this season. They’ll need more of that for a chance to get past the heavily favoured Oilers.


