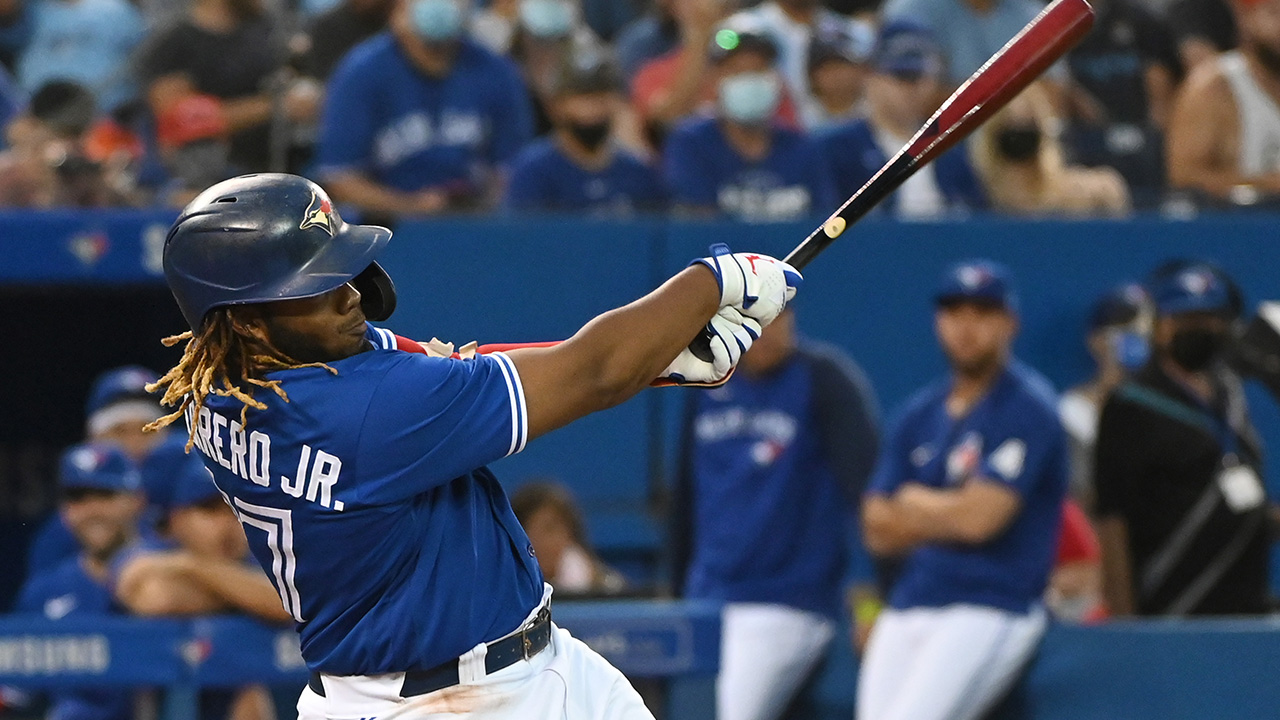
On July 16, Vladimir Guerrero Jr. hit two home runs totalling 808 feet to lead the Toronto Blue Jays to a 10-2 win over the Texas Rangers. It was the first game after the All-Star Break and the 22-year-old’s decision to skip the Home Run Derby in favour of some rest already looked like a great one.
He’d been the best hitter in the world for three-and-a-half months, and there was no reason to expect a slowdown.
Unfortunately for Guerrero Jr. and the Blue Jays, that decline came nonetheless. In his next game the slugger went 0-for-3 in the first half of a doubleheader, and from that point to his 1-for-3 performance on Monday he’s hit just .244/.336/.405 — a rather similar line to the league average of .246/.321/.415.
The contrast between Vladdy’s world-beating early-season production and what Blue Jays fans have seen from him lately is stark, but that doesn’t necessarily mean it’s cause for concern. While there may be some signs of fatigue in his fielding and Sprint Speed numbers, it’s plausible that Guerrero Jr.’s recent struggles are an inconsequential blip.

In order to find out, a little historical context is helpful. Looking at the 20 individual seasons over the last 20 years most similar to Guerrero Jr.’s 2021 (by OPS) we can see if other players in the midst of seasons like his have experienced similar lengthy lulls.
The bad news for Guerrero Jr. is that 34-game stretch of .740 OPS production is worse than any similar stretch in 19 of those 20 seasons. On average, the players with production similar to Vladdy’s (which include names like Albert Pujols, Manny Ramirez, Vladimir Guerrero Sr., David Ortiz, and Miguel Cabrera) produced a .806 OPS in the worst 34-game section of their campaigns.
The 22-year-old’s stumble is far from unprecedented, though. Even his own father experienced a similar stretch (.757 OPS) in 2002— a year when he won a Silver Slugger and finished fourth in MVP voting.
A close examination of downturns during outstanding seasons shows that Guerrero Jr.’s wobble doesn’t guarantee he won’t return to his previous level of production. Here are the five worst stretches by his contemporaries, and what happened next:
Paul Goldschmidt
Season: 2015
Worst 34-game OPS: .750
Rest of season OPS: .996
What happened: In the midst of an outstanding season that earned him a Gold Glove, Silver Slugger, and MVP runner-up status, Goldschmidt lost his touch through August and into early September. His command of the strike zone wavered as he posted a 0.41 BB/K, well below his season-long 0.78. He also lost approximately two ticks off his average exit velocity which ate into his power. Nothing about his offensive profile became disastrous, he was simply ordinary across the board.
From the middle of September on he rediscovered his form, with both his BB/K (0.78) and exit velocity creeping up to an excellent 93.6 mph. All the games after his slump were against divisional opponents Goldschmidt was intimately familiar with, which could have contributed to his rebound, but there’s no obvious explanation for his recovery.

Blue Jays Newsletter
Miguel Cabrera
Season: 2012
Worst 34-game OPS: .750
Rest of season OPS: 1.049
What happened: Although Cabrera’s Triple Crown season in 2012 is a cherished achievement by many baseball fans, few remember that he got off to an unimpressive start. From early April to mid-May he put together a stretch where he hit .290, but only hit five home runs and drew six walks. Reasons for his slow start may have included his adjustment back to third base, and being struck below the eye by a groundball during spring training.
Once he hit his stride, his patience and power returned, and he was an unstoppable force.

Jim Edmonds
Season: 2003
Worst 34-game OPS: .747
Rest of season OPS: 1.015
What happened: Timing-wise, this is a similar story to Vladdy’s. Edmonds scuffled in July to mid-August before finding his footing again. The difference with the outfielder’s slump is that he posted a massive 20.5 percent walk rate during it (with a strikeout rate below his season average) and had a BABIP of .200 — suggesting he might’ve been seeing the ball well and having some bad luck. That said, while we don’t have Statcast numbers for that time, FanGraphs’ numbers indicate his Hard Hit Rate was just 29.3 percent during his rough patch, so perhaps he wasn’t making good contact.
If that’s the case, Edmonds made a serious correction in the season’s finishing stretch. He slugged .646 in his final 28 games of the season, and put the ball in the air 72.9 percent of the time. The bloated 35.4 strikeout rate he posted also suggests he may have found his way out of his funk by swinging from the heels.
Christian Yelich
Season: 2018
Worst 34-game OPS: .737
Rest of season OPS: 1.213
What happened: This is the moment when Yelich became Yelich. After an early career that suggested he had all the tools to be an offensive force if he could get just tap into his power, the Milwaukee Brewers slugger started the 2018 season very slowly before catching fire late in the year, leading to some outlandish first half/second half splits:
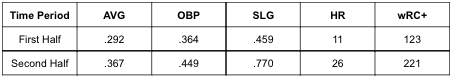
The singular nature of this example makes it tough to compare to Guerrero Jr., but it is a poignant reminder about the unpredictability of player performance.
Joey Votto
Season: 2015
Worst 34-game OPS: .696
Rest of season OPS: 1.079
What happened: Votto has very recently demonstrated how his domination of the mental side of the game can help him right the ship by unlocking newfound power as he approaches his 38th birthday. Perhaps it shouldn’t be a surprise that he finds himself alone here.
In 2015, it was his discipline that he discovered on the fly. During his worst section of the season his BB/K ratio was a decidedly uncharacteristic 0.53, for the rest of the season it was an unbelievable 1.25. That led to a .498 OBP from June on, and a career-high 143 walks — a number only Mark McGwire and Barry Bonds have topped in the last 50 years.
None of these examples prove that Guerrero Jr. will start raking in the days to come. It’s possible he will continue to fade and the lofty company here will become less applicable comps for him. However, these examples show that it’s possible to have lengthy and unimpressive stretches, even in the midst of special seasons.
If you’re the type of player with an OPS hovering around 1.000 it means you wield a world-class bat, and are capable of electric stretches. It doesn’t mean you’re immune to the volatility that comes with playing a game of failure.


